
THE GEOGRAPHICAL
INFORMATION SYSTEM DATABASE
5.1 The GIS
Database
·
The GIS data base is
the collection of graphic (spatial) and non graphic data organized in a
particular structure
5.1.2. Types of
database
There are four main structural types of database management
systems: hierarchical, network, relational, and object-oriented.
1. Hierarchical
Databases

Hierarchical
Databases (DBMS),
·
It is one of the
oldest methods of organizing and storing data, and it is still used.
·
A hierarchical
database is organized in pyramid fashion, like the branches of a tree extending
downwards.
·
Related fields or
records are grouped together so that there are higher-level records and
lower-level records, just like the parents in a family tree sit above the
subordinated children.
·
Based on this
analogy, the parent record at the top of the pyramid is called the root
record.
·
A child record
always has only one parent record to which it is linked, just like in a normal
family tree.
·
In contrast, a
parent record may have more than one child record linked to it.
·
Hierarchical
databases work by moving from the top down.
·
A record search
is conducted by starting at the top of the pyramid and working down through the
tree from parent to child until the appropriate child record is found.
·
Furthermore, each
child can also be a parent with children underneath it.
·
The advantage of
hierarchical databases is that they can be accessed and updated rapidly because
the tree-like structure and the relationships between records are defined in
advance.
·
The disadvantage
of this type of database structure is that each child in the tree may have only
one parent, and relationships or linkages between children are not permitted,
even if they make sense from a logical standpoint.
·
Hierarchical
databases are so rigid in their design that adding a new field or record
requires that the entire database be redefined.
2. Network
Databases

·
Network
databases are similar to
hierarchical databases by also having a hierarchical structure.
·
There are a few
key differences, however. Instead of looking like an upside-down tree, a
network database looks more like a cobweb or interconnected network of records.
·
In network
databases, children are called members and parents are called owners.
The most important difference is that each child or member can have more than
one parent (or owner).
·
Since more
connections can be made between different types of data, network databases are
considered more flexible.
·
However, two
limitations must be considered when using this kind of database.
·
Similar to
hierarchical databases, network databases must be defined in advance.
·
There is also a
limit to the number of connections that can be made between records.
3. Relational Databases

·
In relational
databases, the relationship between data files is relational, not
hierarchical.
·
Hierarchical and
network databases require the user to pass down through a hierarchy in order to
access needed data.
·
Relational
databases connect data in different files by using common data elements or a
key field.
·
Data in
relational databases is stored in different tables, each having a key field
that uniquely identifies each row.
·
Relational databases
are more flexible than either the hierarchical or network database structures.
·
In relational
databases, tables or files filled with data are called relations,
tuples designates a row or record, and columns are referred to
as attributes or fields.
·
Relational
databases work on the principle that each table has a key field that uniquely
identifies each row, and that these key fields can be used to connect one table
of data to another.
·
Thus, one table
might have a row consisting of a customer account number as the key field along
with address and telephone number.
·
The customer
account number in this table could be linked to another table of data that also
includes customer account number (a key field), but in this case, contains
information about product returns, including an item number (another key
field).
·
This key field
can be linked to another table that contains item numbers and other product
information such as production location, color, quality control person, and
other data.
·
Therefore, using
this database, customer information can be linked to specific product
information.
·
The relational
database has become quite popular for two major reasons.
·
First, relational
databases can be used with little or no training.
·
Second, database
entries can be modified without redefining the entire structure.
·
The downside of
using a relational database is that searching for data can take more time than
if other methods are used.
4. Object-oriented Databases (OODBMS)
·
Object-oriented
databases represent a significant
advance over their other database cousins.
·
It is able to
handle many new data types, including graphics, photographs, audio, and video.
·
Hierarchical and
network databases are all designed to handle structured data; that is, data
that fits nicely into fields, rows, and columns.
·
They are useful
for handling small snippets of information such as names, addresses, zip codes,
product numbers, and any kind of statistic or number you can think of.
·
On the other
hand, an object-oriented database can be used to store data from a variety of
media sources, such as photographs and text, and produce work, as output, in a
multimedia format.
·
Object-oriented
databases use small, reusable chunks of software called objects.
·
The objects
themselves are stored in the object-oriented database.
·
Each object
consists of two elements: 1) a piece of data (e.g., sound, video, text, or
graphics), and 2) the instructions, or software programs called methods, for
what to do with the data.
·
The instructions
contained within the object are used to do something with the data in the
object.
·
For example, test
scores would be within the object as would the instructions for calculating
average test score.
·
Object-oriented
databases have two disadvantages. First, they are more costly to develop.
·
Second, most
organizations are reluctant to abandon or convert from those databases that
they have already invested money in developing and implementing.
·
However, the
benefits to object-oriented databases are compelling. The ability to mix and match
reusable objects provides incredible multimedia capability.
·
Healthcare
organizations, for example, can store, track, and recall CAT scans, X-rays,
electrocardiograms and many other forms of crucial data.
5.2 Elements of
the GIS Database
The elements of GIS databases are the graphic and non graphic
coded and stored in the GIS system.
·
Graphical data are the
spatial description of the feature and
·
Attribute data are the
quality or characteristics of the graphic data, the feature.
Graphic data elements are points, lines polygon and symbols that are used
to depict maps and other graphic features.

·
Other graphic elements
are shown below:
·
A point is a zero
dimensional object that specifies a geometric location through a set of
co-ordinates.
·
A node is a special
type of point, a zero dimensional object that is a topological junction or end
point and may specify a geometric location.
·
A pixel -(picture
element) is a two-dimensional picture element that is a smallest indivisible
element of an image.
·
A line is a one-dimensional
object. A line segment is a direct line between two points.
·
A polygon is a
continuous two dimensional object bounded by line segments.
·
Symbols are graphic
elements that reprint features at points on map.
II) Non-graphic
data
None-graphic data
are representations of the
characteristic qualities or relationship of map or graphic features.
Non-graphic data include:
• Attributes
• Topology
a) Attributes
·
Attributes are the
descriptive information about a map or graphic feature.
·
For example attributes for the town plot could
include, plot number, size, name incidents that occurs on it such as ownership,
building permits, surveys or price etc.
·
Geographic indexes are
special types of attributes. These are codes given to a certain features to
distinguish them from another feature.
·
Geographic indexes are also called identifiers
(id). Geographic indexes include street address, box number, parcel number or
an arbitrary assigned number such as polygon 1, polygon 2 etc.
·
b) Topology
·
Topologies are data
that indicate the spatial relationships between one geographical phenomenons to
another.
·
The topological data
include connectivity, adjacency, proximity, and containment.
·
This information are
given in the database because computer cannot recognize that line 1 is
connected to line 2, polygon C is contained in polygon D or feature E is
adjacent to feature F unless these spatial relationships are clearly defined.
·
Such systems are called
raster. In those systems which store graphic and non-graphic data separately,
the data are linked together during analyses or display.
5.3 Spatial Data
Structure
There are two ways of graphic/spatial data representation
techniques: vector and
raster.
Vector
The element of the database that constitutes the points,
lines, polygons, anaotation, nodes, vertex, arc and strings is a vector
representation.
·
With vector representation,
the boundaries or the course of the features are defined by a series of points
that, when joined with straight lines, form the graphic representation of that
feature.
·
The points themselves
are encoded with a pair of numbers giving the X and Y coordinates in systems
such as latitude/longitude or Universal Transverse Mercator grid coordinates.
The attributes of features are stored in the
database management (DBMS) software program
Vector data representation
Raster
·
The raster system do not
defines feature rather the area is subdivided into a fine mesh of grid cells.
·
The cells record the
condition or attribute of the earth's surface at that point.
·
Each cell is given a
numeric value which may then represent a feature identifier, a qualitative
attribute code or a quantitative attribute value.
·
For example, a cell
could have the value "6" to indicate that it belongs to District 6 (a
feature identifier), or that it is covered by soil type 6 (a qualitative
attribute), or that it is 6 meters above sea level (a quantitative attribute
value).
·
Although the data we
store in these grid cells do not necessarily refer to phenomena that can be
seen in the environment.
·
The data grids
themselves can be thought of as images or layers, each depicting
one type of information over the mapped region.
Raster versus Vector
RASTER DATA DISPLAY VECTOR DATA DISPLAY

·
Raster systems are
typically data intensive (although good data compaction techniques exist) since
they must record data at every point.
·
Raster systems have
substantially more analytical power than their vector counterparts in the
analysis of continuous space.
·
Raster is suited to the
study of data that are continuously changing over space such as terrain,
vegetation biomass, rainfall and the like.
·
Raster systems tend to
be very rapid in the evaluation of problems that involve various mathematical
combinations of the data in multiple layers (modeling).
Vector versus raster
·
Vectors systems are
quite efficient in their storage of map data because they only store the
boundaries of features and not that which is inside those boundaries.
·
Vector systems usually
allow one to roam around the graphic display with a mouse and query the
attributes associated with a displayed feature, such as the distance between
points or along lines, the areas of regions defined on the screen, and so on.
·
In addition, they can
produce simple thematic maps of database queries.
·
Vector systems do not
have as extensive a range of capabilities for analyses over continuous space.
·
They excel at problems
concerning movements over a network and can undertake the most fundamental of
GIS operations.
·
Raster and vector
systems each have their special strengths and weakness the current GIS systems
tend to combine both
5.4. Data source
and input
·
Spatial data and
associated attribute are collected from different sources
·
The features described
as the geographic data and their sources are the following:
·
Geodetic control points
from GPS or plane surveys
·
Planementric features
such as roads, buildings, water bodies, and rivers, utility poles obtained from
aerial photographs or maps.
·
Topographic features
such as benchmark points, digital elevation models from surveyed data and
remote sensing.
·
Cadastral features
which are boundaries of ownership or rights, or any other enclosed area
established by legal or administration definition, such as administrative units
(wards, districts, regions, countries) and statistical units or electoral
units.
·
Facility features such
as water supply networks, gas supply networks, sewer, electricity networks
·
Natural features such
as soils, vegetation, water bodies, rock types from surveys, remote sensing.
5.4.1 Data input methods
·
GIS requires the
availability of digital data before analysis and production operations are
performed
·
To create a digital
database you need to convert a full set of existing data into a digital format
or compile a new set of data from the field or remote sensing
·
The procedure of
converting non digital data into digital form is called digitizing and the
processes of importing the data in the GIS system is called data input or
coding.
·
There are several
techniques of data input used to develop a GIs database.
1. Manual digitizing
·
The data that need to
perform manual digitizing are from a hard copy map, hardcopy aerial photography
and or hard copy image.
·
The hardcopy to be
digitized is mounted on the digitizing table or a digitizer
·
Each of the map
features is traced by pointing the stylus and pushing an appropriate button.
·
The scale , coordinate
areas coverage of a map and topological data of features are registered in the
computer system
2.
Photogrammetric digitizing
·
It used to compile new
maps from arterial photographs
·
The table in the manual
digitizing is replaced by a photogrammetric instrument
·
Photogramentric
digitizing is used often to record digital plan metric features and elevation
data from stereo photographs.
3. Scanning
·
Scanning use optical
laser or other electronic devices to scan map and convert them into digital
format
·
Most of the scanners
produce bit maps (bmp) or raster images
·
Scanning is very quick
and less costly.
·
GIS software can
coverts raster images into vector files.
4. Co-ordinate
geometry
·
Coordinate geometry is
software that convert the booked surveyed data to produce maps.
·
The geometric
description of the feature (point of origin, bearing, leg distances) is types
in the computer
·
The software (COGO) the
generate coordinates that are stored to generate maps
·
The technique is
usually used for surveyed data.
5. Key entry and onscreen digitizing
·
Non graphic data and
annotation is commonly entered through typing using a keyboard
·
Some systems allow
onscreen digitizing using a mouse.
6. Digital data transfer
·
Existing data files are
common source of attribute and graphic data for GIS
·
Use of existing data
often requires translation from the original format to the receiving GIS system
format.
7. Remote sensing and GPS data collection
·
Digital images from
remote sensing are directly imported into GIS and are important source of
graphic data.
·
Remote sensing provide
to GIS the graphic data and non graphic data (such as coordinates, quality of
attribute etc).
·
The Global position
system (GPS) the satellite based system for collection of location information
also is used to collect GIS data from the field.
5.5 Sources of errors and quality of spatial data
Errors in data may derive from three main sources:
1.
errors in the source data;
2.
errors introduced during encoding; and
3.
Errors propagated during data transfer and conversion.
1.
Error in the
Source Data
·
Errors in source data may be difficult to
identify.
·
There may be subtle
errors in a paper map used for digitizing that may have resulted
during the creation of paper map.
·
There may be printing errors
in paper- used to create a paper map.
2.
Errors introduced during encoding
·
During encoding a range of errors can be
introduced.
·
During keyboard encoding an operator can make a typing mistake.
·
During digitizing an operator may encode the wrong
line;
·
Folds and stains can easily be scanned and
mistaken for real geographical
features.
3.
Errors propagated during data transfer and conversion.
·
During data transfer, conversion of data between different
formats required by different packages
may lead to a loss of data.
1.
Error Detection in attribute data
·
Errors in attribute data are relatively easy
to spot and may be identified using manual
comparison with the original data.
·
For example, if the operator notices that a hotel has been coded as a cafe, then the attribute database may be
corrected accordingly.
·
Various methods, in addition to manual
comparison, exist for the correction of attribute
errors.
·
These methods include:
Methods
of attribute data checking
Several methods may be used to check for errors
in the encoding of attribute data. These include:
1 Impossible value. Simple
checks for impossible data values can be made when the range of the data is
known. Data values falling outside this range are obviously incorrect. For
example, a negative rainfall measurement is impossible, as is a slope of 100
degrees.
2 Extreme
values. Extreme data values should be cross-checked against the source
document to see if they are correct. An entry in the attribute database that
says the Mountain View Hotel has 2000 rooms’ needs to be checked. It is more
likely that this hotel has 200 rooms and that the error is the result of a
typing mistake.
3 Internal consistency. Checks can be made against summary statistics
provided with source documents where data are derived from statistical tables.
Totals and means for attribute data entered into the GIS should tally with the
totals and means reported in the source document. If a discrepancy is found,
then there must be an error somewhere in the attribute data.
4 Scattergrams. If two or more variables in the attribute data are
correlated, then errors can be identified using
scattergrams. The two variables are plotted along the x and y axes of a graph
and values that depart noticeably from the regression line are investigated.
Examples of correlated variables from Happy Valley might be altitude and temperature, or the category of a
hotel and the cost of accommodation.
5. Trend surfaces. Trend surface analyses may be used to highlight
points with values that depart markedly from the general trend of the data.
This technique may be useful where a regional trend is known to exist. For
example, in the case of Happy Valley most ski accidents occur on the nursery
slopes and the general trend is for accidents to decrease as the ski piste
becomes more difficult. Therefore, an advanced piste recording a high number of
accidents reflects either an error in the data set or an area requiring
investigation.
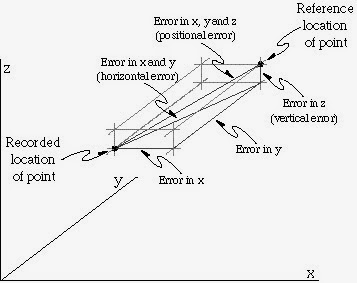
2.
Error in Spatial data
·
Errors in spatial data
are often more difficult to identify and correct than errors in attribute data.
·
These errors take many forms, depending on the
data model being used (vector or raster) and the method of data capture.
·
Some of error in spatial data are:
o
A spatial error may arise if a meteorological
station has been located in the wrong
place,
o
A forest polygon has
been wrongly identified during image
processing
o
A railway line has been erroneously digitized
as a road.
o
Most GIS packages provide
a suite of editing tools for the identification and removal of errors
in vector data.
·
Corrections can be done
interactively by the operator 'on-screen', or
automatically by the GIS software.
·
However, visual
comparison of the digitized data against the
source document, either on paper or on the computer screen, is a good starting point.
·
It is important for data to be absolutely
correct if topology is to be created for a vector data set.
Examples of spatial error
in vector data
Errors will also be present in raster data.
·
Missing entities and noise are particular
problems. Data for some.
·
Noise may be independently added to the data,
either when data were collected or during processing.
·
This noise often shows up as scattered pixels
whose attributes do not conform to those neighboring pixels.
·
Filtering, a technique we
learned in digital image processing can be used to remove these artifacts.
6.0 Spatial Analysis and modeling
·
The analytical
characteristics of GIS categorized in two ways 1) the tools that GIS provides 2) the
operations that GIS allows.
·
Regardless of data
structure raster or a vector system, there
are four basic groups of tools and that three basic operations
6.1 Analytical Tools
6.1.1. Database Query
This group of tools is fundamental
tool of analysis of GIS and these tools work both with the traditional database
and geographical analysis
The database query
simply asks questions about the currently-stored information.
Types of database queries:
1). Query by attribute.
e.g. What section of river has high level of coli form?
2) Query by location?
e.g. What quantity of sediments is derived from this
location?
3) . Complex or
condition queries e.g. show me all wetlands that are larger than 1 hectare
and that are adjacent to industrial lands.
Vector and Raster
analyses
Examples of query by attribute query
What ward in Arumeu
District Has More Women than Men?
Arc GIS Tool= Query by attribute
Example of query by
location
What are land covers
are found in Nelson Mandela Campus?
Arc GIS Tool= Clip
This article was very helpful for me
ReplyDelete